Charlie Ball's regular summary of data and reports from the graduate labour market, brought to you by Prospects Luminate and Jisc Data Analytics
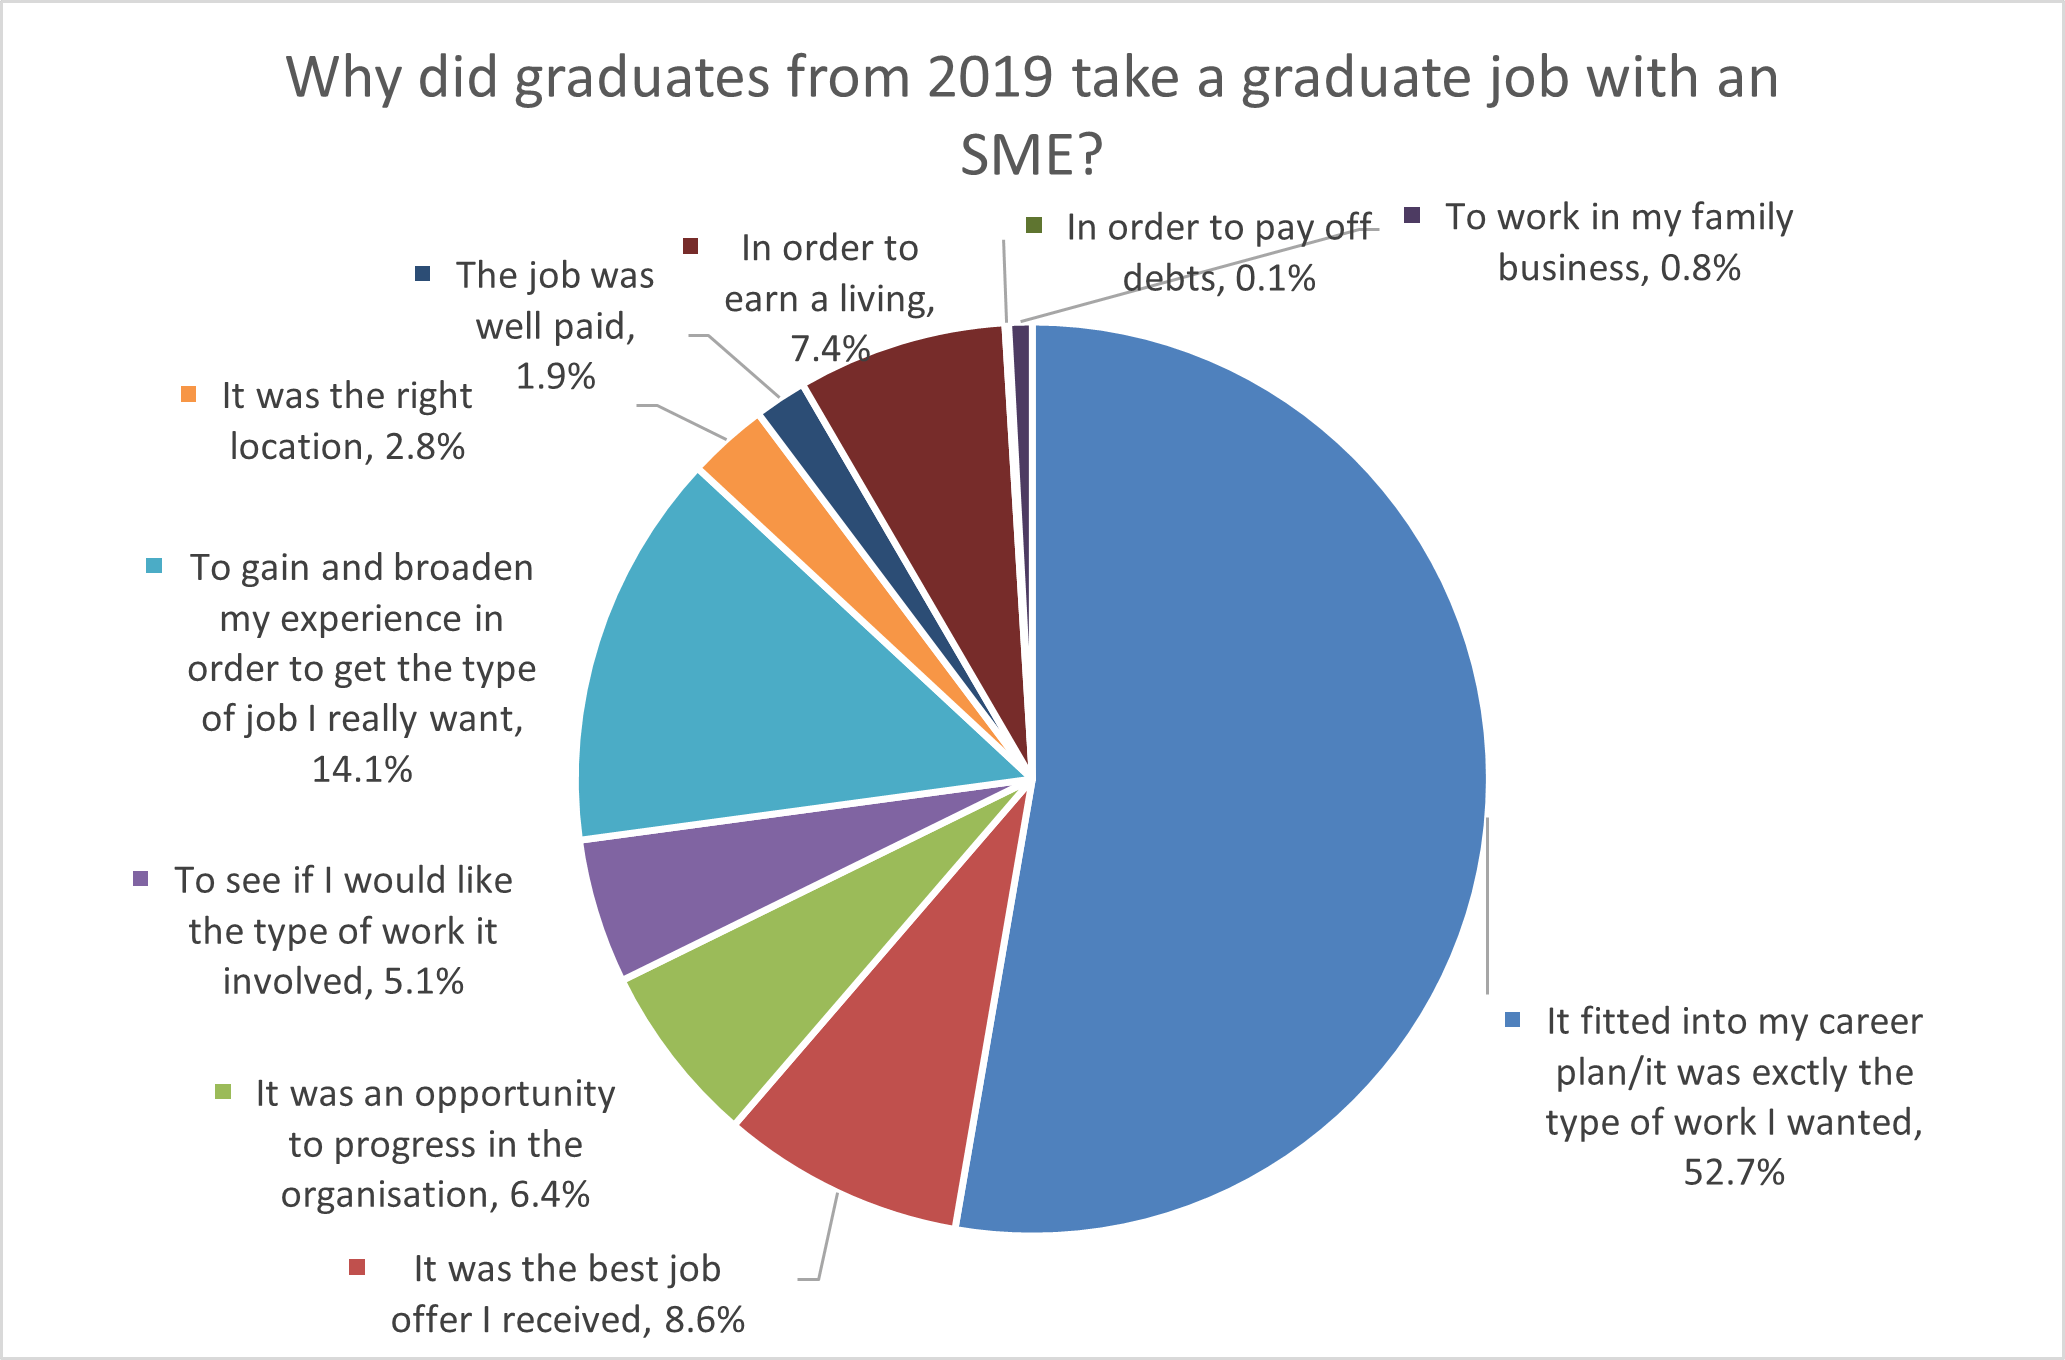
First, a snapshot from 2019 graduates. The majority of those working in small and medium sized enterprises (SMEs), in roles classified as being professional level, stated that their job fitted into their career plans or was exactly the type of work that they wanted. Common roles were in health (medicine, nursing, midwifery, physiotherapy and pharmacy), social work, IT, accountancy, financial services and teaching.
Here's a very brief overview of where we are now:
- The labour market continues to recover but it looks like Omicron is going to put a dent in that.
- The skilled labour market for college and particularly for university graduates is very strong and it looks like a lot of older professionals took retirement during the pandemic so that means more vacancies. As yet we don't know how good that's been for new graduates though.
- Occupational shortages are here to stay, so we will have to get used to them.
- Candidate availability is as low as it's ever been and the ratio of vacancies to jobs as high as it's ever been. Recruitment is going to remain a struggle.
- A quiet story has been the steady drop in self-employment in the UK
- It looks as if workers might be developing a different attitude towards the jobs market. Job searches have less urgency, job quality is more important than pay.
- Hybrid working is here to stay - at least for professionals, particularly in business services and IT. It may be that hybrid working becomes largely a thing that graduates do though.
- Occupational shortages means that business are having to invest more in training and development, something UK plc as a whole has badly underinvested in recent years.
- Business is still working through many of the implications of hybrid working. Recruitment, for example, works pretty well, but business and workers alike are a lot less convinced that hybrid onboarding is as effective as it could be.
- There are particular implications about health, wellbeing and the way that can be supported that are still very live discussions. Most workers feel that, on balance, their wellbeing is better as a consequence of hybrid working but where issues do arise it's not clear yet that business yet has very clear and effective methods of support.
The UK labour market continued to recover in the autumn, according to the Office for National Statistics (ONS).
- August to October 2021 estimates show a continuing recovery in the labour market, with a quarterly increase in the employment rate, while the unemployment rate decreased.
- Total actual weekly hours worked increased by 17.6 million hours on the quarter, to 1.02 billion hours in August to October 2021. However, this is a smaller increase than in previous periods and is still 27.8 million below pre-coronavirus levels (December 2019 to February 2020).
- The UK employment rate was estimated at 75.5%, 1.1 percentage points lower than before the coronavirus pandemic (December 2019 to February 2020), but 0.2 percentage points higher than the previous quarter (May to July 2021).
- The UK unemployment rate was estimated at 4.2%, 0.2 percentage points higher than before the pandemic, but 0.4 percentage points lower than the previous quarter.
- The UK economic inactivity rate was estimated at 21.2%, 1.0 percentage point higher than before the pandemic, and 0.1 percentage points higher than the previous quarter.
- Young people (those aged 16 to 24 years) have been particularly affected by the pandemic. Over the last quarter, however, there was an increase in the employment rate and a decrease in the unemployment rate to below pre-coronavirus rates. The inactivity rate for young people also decreased on the quarter.
Welsh data is here:
- For August to October 2021 the unemployment rate for people aged 16 and over in Wales was 3.7%, lower than 4.2% in the previous quarter (May 2021 to July 2021). This is a decrease of 9,000 people from the previous quarter to 56,000. The unemployment rate in Wales (3.7%) is higher than Northern Ireland (3.6%) but lower than England (4.3%) and Scotland (4.1%).
- The PAYE seasonally adjusted data for November 2021 (1,283,285) shows the number of payrolled employees in Wales is above the number in February 2020. There was an increase of 7,310 payrolled employees between October and November 2021.
- Swansea West had the highest unemployment rate by parliamentary constituency (8.3%) and Aberconwy and Islwyn the lowest rates (1.8%).
Next, data for Northern Ireland is here:
- The latest NI seasonally adjusted unemployment rate for the period August to October 2021 was estimated from the Labour Force Survey at 3.6%. The unemployment rate decreased by 0.4 percentage points over the quarter and by 0.2 percentage points over the year.
- The proportion of people aged 16 to 64 in work (the employment rate) decreased over the quarter by 0.8 percentage points and over the year by 0.8 percentage points to 70.4%.
- The economic inactivity rate (the proportion of people aged 16 to 64 who were not working and not seeking or available to work) increased over the quarter by 1.1 percentage points and over the year by one percentage point to 26.9%.
- Put into the context of the UK, NI had the third-lowest unemployment rate, the second-lowest employment rate and the highest economic inactivity rate of all the UK regions
Scottish data can be found here:
- The latest Labour Force Survey for August to October 2021 indicate that over the quarter, the unemployment rate decreased, while the employment rate increased and economic inactivity rate decreased.
- The estimated unemployment rate (16+) in Scotland was 4.1%, up 0.3 percentage points since December 2019 to February 2020 (pre-pandemic) but down 0.2 percentage points over the quarter. Scotland's unemployment rate was slightly below the UK rate of 4.2%.
- The estimated employment rate in Scotland was 74.6%, down 0.7 percentage points since December 2019 to February 2020 (pre-pandemic) but up 0.5 percentage points over the quarter. Scotland's employment rate was below the UK rate of 75.5%.
- The estimated economic inactivity rate (the proportion of people aged 16 to 64 years who were not working and not seeking or available to work) in Scotland was 22.1%, up 0.5 percentage points since December 2019 to February 2020 (pre- pandemic) but down 0.4 percentage points over the quarter. Scotland's economic inactivity rate was above the UK rate of 21.2%.
- Early estimates for November 2021 from HMRC PAYE Real Time Information indicate that there were 2.40 million payrolled employees in Scotland, an increase of 0.7% (16,000) compared with February 2020 (pre-pandemic). This compares with the UK where the number of payrolled employees has increased by 1.5% over the same period.
- Early estimates for November 2021 from HMRC PAYE Real Time Information indicate that median monthly pay for payrolled employees in Scotland was £2,032, an increase of 8.3% compared with February 2020. This is higher than the growth in median monthly pay for the UK over the same period (8%).
And here is regional data from the ONS:
- Between October and November 2021 the number of payrolled employees in each of the regions of the UK continued to increase, and are now all above pre-pandemic levels.
- For the three months ending October 2021, the highest employment rate estimate in the UK was in the East of England (79.2%) and the lowest was in the North East (70.3%), the lowest employment rate for the region since January to March 2016.
- The largest change in the employment rate compared with the same period last year was in the East of England, with an increase of two percentage points, bringing the employment rate for the region to the highest seen since May to July 2019.
- For the three months ending October 2021, the highest unemployment rate estimate in the UK was in London (5.4%) and the lowest was in the South West (3%). All regions saw a decrease in the unemployment rate compared with the previous quarter (May to July 2021), except for the North East, which was unchanged.
- For the three months ending October 2021, the highest economic inactivity rate estimate in the UK was in Northern Ireland (26.9%) and the lowest was in the East of England (18.2%). The North East saw the largest change in the economic inactivity rate compared with last year, with an increase of 2.1 percentage points; the largest decrease in the economic inactivity rate was seen in Wales, with a decrease of 1.1 percentage points.
- Between June and September 2021, workforce jobs increased in most regions of the UK, with the largest increase of 49,000 seen in Scotland. Of the four regions that saw a decrease, Wales was the largest with a decrease of 33,000. London had the highest proportion of service-based jobs, at 92.8%, while the highest proportion of production sector jobs was in the East Midlands, at 12.4%.
The average age of those in employment has increased, with the number of younger workers falling by 2.5%.
The regular ONS update on the effects of COVID-19 on the economy is here, covering the period to mid-December:
- Of all not permanently stopped trading businesses, 9% reported wages were higher for existing employees over the last month compared with normal expectations for this time of year. In contrast, 8% of all businesses reported wages were higher for new employees.
- There were 13,757 company incorporations in the week to 10 December 2021, broadly unchanged from the previous week and 25% higher than the equivalent week of 2019 (10,988).
- In the period 1 to 12 December 2021, the proportion of working adults in Great Britain who in the past seven days: travelled to work (both exclusively and in combination with working from home) was broadly similar to the previous period (18 to 28 November 2021) at 72%; worked exclusively from home was unchanged from the previous period at 14%; neither travelled to work nor worked from home was broadly similar to the previous period at 14%.
- The total volume of online job adverts on 10 December 2021 was 137% of its February 2020 pre-pandemic average level. This nationwide decline is consistent with the seasonal hiring decline which would be expected at this time of year, however the large falls in some categories may be in part driven by the emergence of the Omicron variant affecting hiring confidence in these categories.
- Of the 28 categories, 23 saw a decrease in the number of online job adverts, while three increased and two were unchanged when compared with two weeks ago. The largest fortnightly increase was in 'legal', which rose by 14%. Meanwhile, the largest fortnightly decrease was in 'catering and hospitality', which fell by 32%. Of the 28 categories, only 'legal' and 'energy, oil and gas' are below their pre-coronavirus February 2020 average level.
There is more on employment and vacancies in the UK here:
- The number of job vacancies in September to November 2021 continued to rise to a new record high of 1,219,000. This was an increase of 434,500 from its pre-coronavirus (COVID-19) pandemic level (January to March 2020), with 13 of the 18 industry sectors showing record highs.
- On the quarter, the rate of growth continued to slow down, and in September to November 2021, vacancies rose by 184,700 (17.9%) (down from a 270,300 (35.4%) increase last quarter). The largest quarterly increase was seen in Human health and social work at 26,000 (15.2%).
- The rate of quarterly growth varied across industries in September to November 2021, with all but one industry displaying positive growth. Water supply, sewerage, waste management and remediation services had the highest growth at 41.7%, while electricity, gas, steam and air conditioning supply fell by 1.7% over the same period.
- The total number of workforce jobs in the UK in September 2021 was estimated to be 35.1 million, despite being down by 525,000 from December 2019. This shows an improving jobs market, following three consecutive quarters of growth helping to reduce the jobs deficit from pre-coronavirus pandemic levels.
Even more from the ONS, who really have been busy, this time on labour market trends and occupational shortages since 2016:
- There were 1.2 million job vacancies in the three months to November 2021, more than half of businesses that reported a worker shortage stated they were unable to meet demands.
- Employment fell by 466,000 (1.4%) in the year ending September 2021, largely driven by younger workers (the number of workers aged 16 to 24 years fell by 201,000) and elementary occupations. Employment had previously been rising by 0.9% on average in the four years prior.
- In September to November 2021, the ratio of vacancies to every 100 employee jobs increased to a new record high of 4.0. Accommodation and food service activities were individually the highest, with a ratio of 7.3 vacancies for every 100 employee jobs.
- The average age of those in employment has increased, with the number of younger workers (aged 16 to 34 years) falling by 2.5%, compared with the number of those aged 50 years and over falling 0.8% in the year ending September 2021.
- In Quarter 2 (April to June) 2021, the majority (89.5%) of workers with a job a year ago remained in the same occupation major group, while 5.6% moved occupation, 1.5% became unemployed and 3.2% became economically inactive; this was broadly the same across the years from 2016.
- In September 2021, there were an estimated 35.1 million jobs in the UK, which was the highest level since June 2020. This represents an increase of 147,000 from June 2021. This was driven by an increase in employee jobs of 269,000, and offset by a fall in self-employment jobs of 125,000, with government supported trainees making up the difference.
- Younger workers (aged under 35 years) were more transient in the workforce, with a high number moving from a job or business and into unemployment in Quarter 2, 2020 at the start of the coronavirus (COVID-19) pandemic.
- Inactivity for workers aged 55 years and over increased in the early stages of the pandemic (Quarter 2, 2020), and while movements to inactivity were lower in the same quarter in 2021, it remained higher than in 2019 before the pandemic.
- The movement of workers into redundancy (including voluntary redundancies) in Quarter 2, 2021 nearly doubled for those aged 55 years and over, compared with the previous year. Early retirement also saw an increase during this period.
- While the overall level of employment rose by 2% between the year ending September 2016 and year ending September 2021, many lower-paid and lower-skilled occupations saw falls in employment during this time. This trend is evident in several elementary occupations such as 'elementary cleaning occupations' and 'elementary sales occupations', where employment fell by 36% and 33.5% respectively, with 'elementary cleaning occupations' seeing the largest absolute fall of 265,000.
- Many higher-paid and higher-skilled occupations saw an increase in employment between the year ending September 2016 and year ending September 2021. Employment in 'IT and telecommunications professionals' and 'business, research and administrative professionals' increased 42.1% and 30.1% respectively. IT and telecommunications professionals saw the largest absolute increase of 407,000. These jobs are largely graduate.
- Associate professional and technical occupations saw the largest change between Quarter 2, 2020 and Quarter 2, 2021 (15.8%), with 4.1% moving to professional occupations. However, associate professional occupations also saw the largest influx of workers, with 11.5% joining from other occupations.
- Of those moving out of their occupation, 14.7% moved to unemployed and 30.9% became inactive. Elementary occupations saw the most workers become unemployed (3.2%), while professional occupations saw the largest move to inactive (5.5%). This may be because of a large increase in retirement within this occupation - many professions, particularly in tech, had an aging workforce going into the pandemic, and this could exacerbate existing shortages.
And finally for this week from the ONS, a fascinating examination of employment in towns:
- Over a third (35%) of people in employment in Great Britain work in less knowledge-intensive service industries. A further 29% work in other knowledge-intensive services with 20% working in high-tech or knowledge-intensive financial and market services. Another 8% work in manufacturing (5% in medium and high-tech manufacturing industries and 3% in low-tech manufacturing).
- Towns have a relatively high share of the employment in England and Wales in the high-tech (65%) and medium-tech (62%) manufacturing industries.
- Towns have a relatively low share of the employment in England and Wales in the knowledge-intensive market services (46%), knowledge-intensive financial services (38%) and high-tech services (43%).
- Towns with an industry structure dissimilar to that of Great Britain overall were more likely to have above average employment growth in the decade to 2019.
- Businesses in high-tech and knowledge-intensive services tend to be located much closer to each other, forming clusters of employment.
- For example, high-tech services (such as information and communication service industries and scientific research and development) form a large cluster in the south of England, mostly in Cambridge Travel To Work Area (TTWA) and in TTWAs along the M4 like Reading and Newbury and TTWAs such as Oxford, Guilford and Aldershot, and Basingstoke.
- Knowledge-intensive market services (which include service industries such as air and water transport, professional, scientific and technical activities, and administrative and support service activities) also form a large cluster that goes from Crawley TTWA, in the South East of England, along the M1 all the way to the North West of England.
- The knowledge-intensive financial services, on the other hand, are concentrated in a few small clusters distant to each other, but mostly in TTWAs that include part of a conurbation or a large town or city. This includes Bournemouth, Swindon, Skipton, Halifax and Edinburgh TTWAs.
- Employment in manufacturing, although not widely spread like the less and other knowledge-intensive services, is still found scattered around many parts of the country. However, the patterns of concentration vary with the type of manufacturing.
- There are pockets of low-tech manufacturing industries in almost all parts of England and Wales, except in London and in the South East regions, but it is in the eastern areas of the country that the concentration of these type of industries is denser.
- In contrast, medium-tech manufacturing industries are mostly located in South Wales' TTWAs and in most TTWAs stretching from West Midlands to the south of Yorkshire and The Humber.
- High-tech manufacturing is concentrated in a few TTWAs mostly in the South East and in the East of England, with some pockets of concentration scattered around the rest of the country.
There's a lot more in this exceptionally interesting report - it is highly recommended.
Employment is still more than half a million below its pre-pandemic level, largely reflecting a big decline in self-employment.
Some other organisations than the ONS also did some things last week. The Home Office Migration Advisory Committee (MAC) have released their annual report:
- The UK's new points based system of immigration meant that the range of jobs that can be filled by migrants on a skilled work visa expanded to include those at RQF 3-5 (at or above A-level, NVQ3 or equivalent), reducing the threshold from RQF 6+ (degree level or equivalent and above). The general salary threshold was also reduced from £30,000 to £25,600, in line with MAC recommendations, to reflect the broader group (RQF 3-5) who are now eligible occupations for this route. Lower thresholds may be in place if the occupation is listed on the Shortage Occupation List (SOL), the individual has a PhD, or if the occupation is based on national pay scales but can in no circumstance be less than £20,480.
- There was a clear decline in the number of applications during the first national lockdown as a result of the pandemic making cross border movements more difficult and the temporary closure of the UK Visa Application Centres (UK VACs) making it difficult for individuals to apply for visas to enter the UK. Visa processing times were also impacted by decision makers needing to access office locations to complete processing. By contrast, subsequent lockdowns appear to have had very little effect on visa applications for the work route, and in fact in the first three months of 2021 the number of visa applications was over 70% higher than that seen in the first three months of 2019.
- So far in 2021 MAC has seen little use of the route for these expanded occupations, with over 90% of applications being for roles at RQF 6+. Breaking the data by nationality shows no significant difference, with European Economic Area (EEA) and non-EEA nationals applying for RQF 6+in 86% and 91% of applications respectively. Of the 5,200 applications for roles in RQF 3-5 occupations over a third were for senior care workers. The rate of applications for senior care workers has risen over the course of the year and is currently around 400-500 per month.
- 54% of visa applications in the first nine months of 2021 were for occupations that are listed on the SOL. This is an increase to that seen in 2020 (43%), and a significant rise on the 17% in 2019.
The Recruitment & Employment Confederation (REC) have produced their annual review of the UK recruitment industry:
- The recruitment sector employed 110,000 people in more than 30,000 businesses in 2020, slightly lower than the previous year.
- The wider recruitment industry contributed £35.9billion in Gross Value Added (GVA) to the UK economy in 2020. This was down by 11.5% from the previous year, but shows the resilience of the sector during the pandemic.
- During 2020, recruiters placed an average of 980,000 temporary workers on assignment every day, around the same number as 2019. They also placed 450,000 people into new permanent roles over the course of the year, 55% fewer than 2019.
And here's Indeed's review of the 2021 labour market:
- The UK labour market has staged an impressive comeback from the pandemic in 2021. However the labour market's recovery is incomplete. Employment is still more than half a million below its pre-pandemic level, largely reflecting a big decline in self-employment. The number of economically inactive people - those neither working nor actively seeking employment - is also over half a million higher than on the eve of the crisis.
- Changes in relative jobseeker interest over the pandemic illustrate the extent to which candidate availability has tightened in lower-paid sectors. Conversely, higher-paid categories have become relatively more popular with jobseekers.
- In general, the biggest falls in relative jobseeker interest have been in lower-paid sectors that recently have grown strongly, like cleaning, warehousing, construction and hospitality. Much of the declines in these areas happened after the reopening roadmap was announced on 22 February, 2021. Falling relative jobseeker interest indicates the supply of workers has not kept pace with resurgent demand.
- More broadly, Hiring Lab surveys find job search lacks urgency for many workers. Even those currently out-of-work are in little hurry to find new jobs. Survey respondents continue to cite financial cushions, caring responsibilities and health concerns related to COVID-19 as factors holding back search.
- Resignations as a share of job-to-job moves are not at historically high levels. What appears to be happening is not a mass reassessment of priorities. Rather, voluntary job moves are ratcheting up as labour demand bounces back, giving people more options. Meanwhile, job switches postponed during the pandemic have finally had chances to take place.
- A range of factors was motivating people to look for new positions, with higher pay cited by 44% of respondents, the most frequently reported reason. Given high inflation, pay might become even more important in 2022. Changes of career path, better benefits and more flexibility were also popular factors motivating people to search.
Finally, this academic paper from the Cambridge Journal of Economics - What matters more for employees' mental health: job quality or job quantity?
- A job's quality matters more than its quantity as measured in hours per week.
- The results show that actual working hours are hardly related to employees' mental health but job quality, especially intrinsically meaningful work, less intensified work and having a favourable social environment, has positive effects on employee mental health, even in jobs with short working hours.
- Moreover, although working less than one prefers (under-employment) has negative effects, these negative effects become much smaller in size and non-significant in good quality jobs, especially in jobs with skill discretion and good job prospects.
Written by

Was this page useful?
Thank you for your feedback